

Every mobile app needs marketing to reach out its potential users and thereby an app owner can build a sustainable app business. Even in a case of mobile apps for e-commerces businesses, where an app is just a new channel to reach customers, app marketing is needed to reach out new customers.
Now, mobile app marketing is based on a few business models. From one-off payments to costs-per-metric, there is a number of models for mobile app marketers to choose from upon launching an app’s advertising campaign. CPI, or Cost Per Install, is one of them, and while on the surface the name makes it sound deceptively simple (Cost-Per-Install means app marketers pay when someone installs their app – simple enough, right?), there is actually plenty of nuance to it. As the app market grows, app marketers are in a tough ever-increasing competition for app users’ attention and ultimately their wallets. Therefore to meet their marketing goals, marketers may utilize all above mentioned models.

Picture This: Fully-Optimized CPI, User Acquisition at Scale
You may be asking, how can I optimize my app’s user acquisition potential? We have a mobile expert team with a playbook of best practices to answer that.
Learn moreThis guide will help you understand the ins and outs of the CPI payout model in particular, what CPI advertising and CPI marketing are, and how they compare to other metrics. As well as how much does it cost to drive app installs via Facebook, TikTok, Google Ads and more.
If you aren’t familiar with CPI advertising or CPI marketing term, let’s us explain. A mobile app advertising campaign can be built around a number of different models, each implies charging the app marketer when a particular action is taken. If the entire advertising campaign is based around charging per an app install, another words it’s CPI-based, marketers refer to it as CPI marketing.
First things first, let’s start with providing the set of stats that draw the picture for Cost Per Install for apps in general, mobile app games and ad platform specific.
Key Average Cost Per Install Statistics:
- iOS CPI globally – $1.5 to $3.5
- Android CPI globally (Google Play market) – $1.5 to $4.00
- Mobile app CPI, by location:
- APAC – $1.5 to $3.00
- EMEA – $2.00 – $4.00
- Latin America – $0.50 – $2.00
- North America – $2.5 to $5.00
- iOS Games CPI – $2 – $5
- Android Games CPI – $1.5 to $4.00
- Facebook Ads CPI – $1.00 to $3.00
- TikTok Ads CPI – $0.50 to $2.50
- Google Ads CPI – $0.50 to $2.50
- Ad Networks CPI – $1.75 to $4.5
Before diving into the specifics, it will certainly make sense to give a definition for what is Cost Per Install and how to calculate it.


Cost per install (aka CPI) – a definition and formula
The most concise definition is:
“CPI (Cost Per Install) – the amount of money spent to generate one install of a mobile app.”
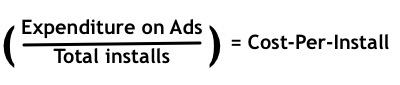
The formula for calculating Cost Per Install is quite simple, in fact, it’s implied in the name: Your total ad spends divided by a number of installs.
Now we’ve set our terms, let’s have a look at what a Cost Per Install campaign is and why it is important.
What is a CPI campaign and why is it important?
Cost Per Install is one of the many metrics by which app marketers measure spending of their mobile app marketing budget. The advertiser only pays the online ad platform or ad network once the app is installed, instead of just the advert being viewed (known as the CPM, or Cost Per Mille, model). This puts the onus on ad networks to place the advert in mobile apps and websites where conversion rates are high and to target the ad appropriately to the correct audience. This is a direct incentive for ad networks to optimize mobile app install campaigns as efficient as possible.
Given the higher value behind an app install over a simple viewing of the advert, costs per install are also significantly higher – in some places around $5, whereas CPM can vary wildly from $0.78 to $7.00 depending on the platform (iOS/Android) and the advert format (interstitials, banners etc).
Why is CPI a valid metric?
Back in May 2016 Fiksu (now BidMind), a major mobile marketing company, stopped featuring CPI statistics in their core set of Index reports. According to the company, “although it still has a role, CPI should no longer be the central metric to measure app marketing success.” The reasoning behind was that the increasing number of reports demonstrated that the “app craze” was waning. People downloaded fewer apps than before, and open even fewer; as such, a “mere” app install was no longer a good metric of whether your app was successful. This, coupled with the fact that the most successful apps are free to download and monetize via in-app transactions or eCommerce, also puts paid to this theory.
That being said, CPI is still more important than CPM if what you’re advertising is the app itself, and not an eCommerce product. It’s still a great metric for games, especially if you set the pay-out to trigger upon a certain achievement in the game which is far more indicative of user engagement than just downloading.
Top Mobile Advertising Companies:
CPI providers have wisened up to the “end of the app craze” and there are plenty of ways of making the metric significant and of making CPI campaigns successful. Other metrics which you should consider alongside CPI are Cost Per Loyal User/Cost Per Engagement (the line between the definition of these two is becoming increasingly blurred) and Cost Per Sale (only triggers when a sale is made).
Hands down the biggest driver behind growth of the mobile app ecosystem are games and so let’s take a close look at how much it takes to generate a mobile app game install on major mobile platforms and for different types of games.
Cost Per Install iOS vs. Android games, by category
To that end, let’s put together the data to compare Cost-Per-Install for iOS and Android games, stacking data points for Casual, Mid-Core, Hardcore, Puzzle, Strategy, Action, RPG, Sports, Simulation, and Arcade games.
The difference between an average iOS CPI for Casual games and Android is significant and iOS is the winner in this competition, it’s $1.5 for Android versus $2.5 for iOS. This gap can be attributed to a higher lifetime value of iOS users, since historically iPhone owners tend to spend more on mobile apps, as well as on any Apple products or services in general. This higher value invites advertisers to spend more money to acquire these app users and it drives the CPI up.
Indeed, it costs on average $4.5 to generate a single iOS Mid-Core game install compared with $3.25 for its Android counterpart. A Hardcore game install costs $6 for iOS and only $4.5 for Android, $3 for Puzzle games for iOS versus $2 for Android, $5.5 for iOS for Strategy game players vs. $4 on the Android side of the equation. In fact, this trend, higher iOS than Android CPI, can be been seen across all game categories.
Average Cost Per Install (CPI) of mobile games worldwide, by genre and platform
Source: AppsFlyer, Adjust, Sensor Tower
From cost per install for mobile games to how much it costs to acquire app users via paid ad platforms from all major social media platforms.
Facebook Ads Cost Per Install
On the current digital marketing landscape, one of the major sources to find new users for an app is social media. By now, all major social media companies provide paid advertising solutions, such as: Facebook Ads, Google Ads, TikTok Ads, Snapchat Ads, Reddit Ads, Pinterest Ads, X Ads (former Twitter Ads) that allow app marketers to acquire installs for their apps. All of these platforms leverage data they accumulate on their users to identify people’s preferences, likes and habits to supply app marketers with valuable information for effective targeting.
We’re going to begin with the Facebook Ads platform as one of the oldest and, to this day, most efficient ones that help app developers and brands reach out specific app user segments across the world.
As you can see on the graph below, CPI for Facebook Ads has been steadily growing over the years and there are several factors that influence this growth such as privacy regulations, market competition, ad quality and relevance, economic factors, and more. Privacy regulations wise two major contributors should be named – GDPR law that was introduced in 2018 and forced European app developers, as well as developers outside of Europe as well because the Internet has no real boarders, to change their app users data policy. The Apple’s ATT framework, introduced by Apple in 2021, is another privacy regulation, this time introduced not by government but a private corporation, changed the landscape of CPI rates even more.

User Acquisition Services Buyers guide
Download our User Acquisition Services Buyers guide to get a full list of the best service providers on the market to choose from. The guide also covers what is a user acquisition company and how to choose the right one.
Naturally, as time goes by the number of apps that compete for app users’ attention and wallets grows and it drives CPI up. Last, but by any means, not least factor was COVID-19 that reshaped the app industry and significantly impacted pricing of acquiring app users via Facebook Ads. In 2019 it cost anywhere between $1 and $3 dollars to acquire a single install via the Facebook paid ad platform, by 2023 this range doubled with $2 minimum and as high as $5 maximum to generate a single app install. For this year it’s projected that the minimal Facebook Ads CPI will stay $2 but the maximum will jump to $5.5.
Facebook Ads Cost per install 2019-2024, $
Sources: AppsFlyer, Adjust, Sensor Tower
For a number of years the paid mobile user acquisition landscape was divided between Facebook Ads and Google Ads but then TikTok Ads came along and it changed everything. Let’s switch to this status quo challenger and CPI rates app developers and brands should expect for running UA campaigns on it.
TikTok Ads Cost Per Install
As another big player on the market of digital paid advertising, TikTok Ads platform has been influenced by the same factors as Facebook Ads – privacy regulations, economic factors, ad quality and relevance, as well as some different ones, let’s focus on these.
First up is ad innovation – TikTok brought to the video sharing platforms space, previously dominated by YouTube and Instagram, entirely new style of shooting video clips. This style set the tone for what ads are being run on the platform and pricing generating app installs via this new video ad style. The other factor, that is impossible to miss, is a looming threat of being banned in the US that ultimately manifested as a brand new law that forces Bytedance, the company owner, to sell it to a US company or being banned within a year.
In 2020 TikTok Ads Cost Per Install took a modest start with a minimal rate of $0.75 per install to $2 maximum, by 2023 this rate doubled for the minimal value to $1.5 and almost doubled for the upper limit – $3.5 per install. For 2024 it’s projected that a single app install via TikTok Ads will cost between $1.75 and $4 per install.
Sources: AppsFlyer, Adjust, Singular
Now let’s jump back to a paid adverting platform to drive mobile app installs that shared the digital advertising duopoly before the rise of TikTok – Google Ads.
Google Ads Cost Per Install
Turning to paid ad platform to acquire mobile app users from Google, we see the biggest delta between minimal and maximum price for a mobile app install marketers pay on Google Ads. On top of all previously mentioned factors that influence fluctuations of CPI rates, for this platform specifically we need to mention automation that Google brought to its Google App Campaigns solution back in 2019 and it meant to maximize UA campaigns efficiency without any advertisers’ intervention.
Essentially it was plugging AI to running the platform to take care of on-the-fly non-stop changes to campaigns bidding, ad creatives tweaking, essentially all settings of the ad campaign. This is how Google aims to help app marketers to leverage its huge audiences across Search, Google Play, YouTube, Discover on Google Search, and the Google Display Network.
Having said all this, here is how Google Ads CPI has been changing over the years. In 2019 app marketers could generate a mobile app install for a price ranging from 50 cents to $2. By 2023 running UA campaigns on Google Ads, app marketers paid from $1.5 to $4 per install, for this year a prediction calls for as the same $1.5 minimum and up to $4.5 per a single app install.
There is one change, that Google has been rolling out gradually in 2024, which is its Search Generative Experience – Generative AI-based tech to answer queries comprehensively right on a search results page, which is yet to influence both native and paid traffic from Google and it certainly has a potential to change Cost Per Install for Google Ads.
Google Ads Cost per install 2019-2024, $
Now, when we’ve reviewed CPI rates for all major paid ad platforms from the biggest players on a market – Facebook, TikTok and Google Ads, let’s turn to the Cost Per Install rates for major mobile advertising networks that aren’t affiliated with any social network, video sharing platform or a search engine. As of this writing, these ad networks are Unity, Applovin, ironSource and Vungle.
Ad Networks Cost Per Install
For the last five years all ad networks CPI rates we review in this section have been influenced by the same common factors – market competition, targeting capabilities, ad quality and format, user demographics, app category, seasonal trends, network performance metrics, tech advancements and economic ones. With the exception of 2020 and partially 2021, when COVID-19, obviously, had a major impact on the entire economy and hence influenced Cost Per Install rates ad networks had in those years.
Above all other factors, advertiser demand and ad inventory supply have been setting the tone for ad networks CPI rates to go up or down. The more advertisers join the platform, the higher is competition and hence the higher rates. Limited availability of premium ad inventory has also contributed to how low or high Cost Per Install were for a particular ad network.
Another big contributors are conversion rates and engagement metrics. With these two things are pretty straightforward – the higher conversion rate the lower CPI, because app marketers manage to acquire app users more efficiently and it lowers the rates.
Finally, introduction of Machine Learning and AI into the technological stack of these ad networks allowed to provide better targeting and effectively lower CPI rates. The rise of programmatic advertising allowed for more efficient and automated ad buying, impacting CPIs based on the effectiveness of the bidding algorithms.
With all in mind, let’s take a look at specific numbers for the rates from 2019 to 2023 and a projection for 2024. As of 2019, on average it took anywhere in between $0.50 / install either on iOS or Android to $2.00, in 2020 these figures raised to $0.75 and $2.5 respectively. From 2021 to 2023 each year brought additional $0.50 for both minimum and maximum CPI rates. For this year, 2024, the projection is that it will be costing app marketers to generate a single app install between $1.75 and $4.5.
Ad Networks CPI rates for mobile apps over time, $
Sources: AppsFlyer, Adjust, Singular
The next logical question, after building a comprehensive picture of major paid ad platforms and ad networks, is how to choose the right CPI network or platform for your mobile app user acquisition campaign.
How to choose a CPI network / platform
There is a number of things you should look at when choosing your CPI campaign provider. A well-targeted CPI campaign will often be successful, but the devil is in the detail, so these are the things to look out for.
Target audience alignment
The right targeting of your user acquisition campaign is a number one priority – it’s just obvious that you need to communicate to people who are potentially interested in your app. Hence user demographics and geographic reach are two things you need to check a specific network or platform you’re considering to use for your UA needs. With the right demographics you make sure you’ll be approaching people of a gender, age, location and interests you need and for the right geographic reach you need to pick up a network / platform that has a strong presence in that particular region.
Ad formats and creative options
The general rule of a thumb is that you need to find ad networks and platforms that offer a variety of ad formats and is flexible with A/B testing so you can find the right combination of text, image and video creatives to deliver the most engaging messages to your audience.
Platform reach and inventory
To being able to grow your mobile app user base continuously over time you need an ad network that will provide big enough user base. Another important consideration is to make sure that platform or an ad network can actually provide inventory with premium and relevant contexts to make your ads content relevant.
Targeting capabilities
Ideally to aim for ad networks or platforms that provide the best in class targeting capabilities, the more granular they are, the more types of information they utilize to target your ads the better.
Performance tracking and analytics
Real-time analytics and reliable attribution tools are must in your app marketing campaign toolbox. Both will inform your ad campaign and help you to make right choices about what ad channels to use and what to change in your app.
Cost and pricing models
Of course specific ad network or platform Cost Per Install will be one of the factors to allow you to choose the right partner. Budgeting options are also something you need to look after to being able to set daily cups and lifetime budgets.
Fraud prevention
This list of things to consider wouldn’t be complete without factoring in fraud prevention. Unfortunately, it’s a well-known fact that a significant portion of digital advertising budgets are spent on fraudulent traffic. Make sure you check what specific measures and tools are in place to counteract fraud on a platform or ad network you evaluate.
Compliance and Privacy
Ensure the network or platform complies with relevant privacy regulations (e.g., GDPR, CCPA) and has robust data protection practices. Evaluate how the network handles user data and privacy concerns, particularly in light of increasing regulatory scrutiny.
Final Thoughts
As of today CPI metric has definitely lost its initial appeal to mobile app marketers but it is still a part of the app marketing efforts equation. With CPI campaigns app marketers may achieve several goals. Such as growing the number of users their apps have, boosting an app’s ranking on the App Store / Google Play market to secure it higher visibility, increase the number of users for their apps, while App Store Optimization they’ve been applying, hasn’t impacted their native user acquisition yet and more.
The most popular social networks provide highly effective advertising platforms for mobile app marketers to leverage their extensive user profile data sets. As a metric Cost Per Install should always be measured and optimized in conjunction with the Cost Per Action model that measures app marketers’ expenses to achieve specific actions for their apps – in-app purchase, registration, subscription, and more.