
Mobile advertising campaigns are run using different business models. Some of these models, such as the CPM one is a darling of many web and mobile app publishers. With this model, it doesn’t matter if any ads placed in their inventory generate clicks or lead to actions or not – they are get paid by advertisers.
Now on the other hand, being on a constant quest for new ways to increase their revenue, more and more mobile advertisers prefer the CPA (stands for Cost-Per-Action) model, which really gives them a freedom to spend money only when ads they place in publishers inventory result in specific actions taken outside of the app, such as a sale, lead generation and so on and not views or clicks. The go-to tactic to generate all these actions is to incentivize a Cost Per Action ad campaign audience with a financial or other types of a comparable reward.
What is CPA advertising and what are its pros and cons?
To run a CPA advertising campaign mobile marketers use ad platforms that charge them only when app users, people who click on the ads, take specific actions.
The formula to calculate Cost Per Action (aka CPA) is the following:
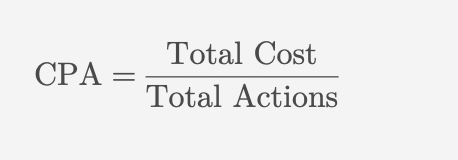
Where:
• Total Cost is the total amount spent on a mobile ad campaign or marketing effort.
• Total Actions is the total number of desired actions taken by mobile users (such as purchases, register, downloads, etc.).
With this payment model, advertisers get flexibility to spend their ad budget on channels that do generate actions they are after. On the flip side, not all ad platforms support such model, you can find companies that do support CPA model in our directory.
A few examples when CPA advertising is effective:
- conducting a survey – often one of major obstacles for conducting an online survey is the difficulty to find and sign up participants – their engagement presents a real challenge. In this case, mobile marketers pay publishers for every participant that comes from their web or mobile app inventory;
- building an email list – email is one of the backbones of digital marketing but building an email list is yet another challenge that CPA ad campaigns are capable to help with;
- signing up for a free trial – this is about how software and SAAS company reach out prospective clients to sign up for a free trial they offer;
- placing an order – the spectrum of products that can be purchased online is getting bigger all the time, CPA advertising is often what helps mobile marketers to move the needle for their business. Direct-to-consumer companies run primarily CPA ad campaigns to sell their products globally;
- sharing content on social media – social media marketing is all about spreading the word and CPA advertising campaigns are one of the ways to reach out wide audiences, in this case advertisers pay for every instance their content was shared on a specific social media platform.
Another example when CPA campaigns are effective is such a value exchange model as the Offerwall that is popular and widespread in mobile games. A typical Offerwall allows gamers to acquire in-game currency in return for filling in a survey or watching a video in the app.


Now let’s take a close look at various costs associated with CPA advertising, starting with the list of the key stats.
Key Cost Per Action Statistics:
- 2023 purchase model CPA rate – $23.20 to $72.18 (depending on the region)
- 2023 subscription model CPA rate – $28.95 to $63.28 (depending on the region)
- 2023 purchase model install-to-action rate – 10-15%
- 2023 subscription model install-to-action rate – 15-20%
- 2023 APAC Purchase model CPA rate – $24.84 to $40.00
- 2023 APAC Subscription model CPA rate – $30.42 to $48.13
- 2023 EMEA Purchase model CPA rate – $40.44 to $50.57
- 2023 EMEA Subscription model CPA rate – $35.45 to $52.47
- 2023 LATAM Purchase model CPA rate – $23.20
- 2023 LATAM Subscription model CPA rate – $28.95
- 2023 NAR Purchase model CPA rate – $62.58 to $72.18
- 2023 NAR Subscription model CPA rate – $54.16 to $63.28
- 2023 Facebook Ads Cost Per Action rate: $18 to $30
- 2023 Google Ads Cost Per Action rate: $30 to $50
Having the terms defined and the key stats listed, let’s analyze one-by-one all major benchmarks that establish the Cost Per Action rates for the app industry.
Mobile Ad Network Cost Per Action Rates
Among many actions that app users take via the app, there are several that are crucial for app marketers to know how much it costs to get users to take those actions and the most essential are Purchase and Subscription.
Looking at the Liftoff’s, app marketing and retargeting company, data for the 2019-2024 period, we see the following picture. In 2019, to generate a purchase via mobile, e-commerce brands had to pay anywhere between modest $15.00 to $35.00 per purchase. In 2020, the range was between $20.00 to $40.00 per purchase.
In 2021, the purchase model CPA got a significant boost – it cost between $30.00 and $50.00 to generate a single purchase and it stayed flat in 2022. In 2023, the range got wider – between $25.00 and $70.00 per purchase. This year, it is projected that the purchase CPA rates will fluctuate between $35.00 to $55.00.
For the subscription model, the dynamics were different, in 2019 for e-commerce companies it cost between $20.00 to $45.00 to acquire a single subscriber. In 2020, the year when the pandemic hit the world and demand on media subscription services shot up, the subscription CPA rate went up – 25.00 to $50.00 per subscriber. Just like with the purchase CPA rate, in 2021-2022 period the CPA rate for the subscription model stayed flat between $35.00 to $55.00. In 2023, the rate began to fluctuate again – this time between $30.00 to $65.00. In 2024, it is projected that it will be between $40.00 and $60.00 / subscription.
Cost Per Action rates, 2019-2024 ($)
Source: Liftoff
Apart from the actual cost for app purchases and subscriptions, there is another important metric that should be on the app brands’ radar – the Mobile App Install-to-Action rate.
Mobile App Install-to-Action Rates
With this benchmark, app marketers can assess how well they manage to convert downloads the app is getting to the ultimate goal – generate sales. To calculate the rate, one needs to divide the number of either purchases or subscriptions to the total number of installs for a specific app.
The Liftoff’s research data for 2019, the pre-COVID year, shows that the install-to-action rate for purchases and subscriptions was between 5% and 10%. But in 2020, overall the average rate got a slight bump – 1% and it ranged from 6% to 11%.
Now, it is worth to compare the install-to-action rate for the purchase model versus the subscription one. The former fluctuated between 8% to 12% and the latter fluctuated between 10% to 15%. These benchmarks reflect on the situation when people generally became more cautious with how much they spent on products and services but became more prone to spend on subscriptions for the apps like like Zoom, Peloton, Netflix, people had to begin working remotely, exercise at home and spent more entertaining themselves watching Netflix, Amazon Prime Video and alike.
Again, in 2021-2022 period the install-to-action rates remained stable, ranging from 7% to 12%. But the next year the install-to-action rate for the purchase model went up to 10% to 15% and its subscription counterpart even higher – 15% to 20%.
If the current forecasts are correct, we should expect in 2024 the install-to-action rate for the purchase model to change between 12% to 17% and the subscription install-to-action rate – from 17% to 22%.
App Install=to-Action Rates, 2019-2024 (%)
Source: Liftoff
Now, let’s see what are CPA costs for specific app categories such as e-Commerce, Finance, Gaming, Social, Travel and Utility.
Mobile App Category Cost Per Action Rates
According to the Liftoff’s data, across all six categories the purchase CPA rate is the biggest and the install CPA is the smallest.
Slicing the data along the install CPA rate, we see that the travel category is the most expensive – it costs $5.50 to acquire a single install for a travel app, followed by finance with $5.00 and the cheapest is utility with only $3.00 per install. Subscription CPA wise, the most expensive category is finance with $50.00 / subscription, followed by travel with $42.50 / subscription, at the very end of the line is utility with just $27.50 / subscription. Turning to the purchase CPA, we see that, again, utility category is the cheapest with $32.50 / purchase and, like we said earlier, finance is the most expensive with $60.00 / purchase.
It’s worth to notice that in previous years the subscription CPA was the highest, now it’s turned its leading position to the purchase CPA rate. It speaks to the fact that the subscription model adoption continues to grow and it becomes progressively cheaper to acquire app subscribers, or at least cheaper than it used to.
Cost Per Action Rates, by app category, in 2023 ($)
Next up is the benchmark that assess how difficult it is to convert an app install into a specific action, such as – register, purchase or subscription.
Mobile App Category Install-to-Action Rates
The app store structure is built on a set of categories for reason – every category meets specific needs of app users. Obviously, people value and prioritize their needs differently, hence the difference for on how many occasions they take action in the apps they download. The Install-to-Action rate for app store categories clearly illustrates this difference with numbers.
Let’s take a close look at the Social category, because it features the most dramatic difference between this ratio for the actions we analyze – register, purchase and subscription.
Hands down the Social category registrations enjoy the highest conversion rate – 27.5% of app users who download social networking apps open an account. It is absolutely make sense – we people are social beings and if we download an app for social networking our intent is always clear to actually start using the app.
Now, that is not the case when it comes to making in-app purchases inside social networking apps and paying for a subscription. It can’t be helped – because historically apps like X (used to Twitter), Facebook, Instagram are being free to use – and to this day for the most people they are – people have a hard time to accept the need to pay for any social networking apps functionality. Hence the numbers – only 10% of app users make in-app purchases and 8% pay for subscriptions for social networking apps.
Featured App Marketing Services
For other app categories Install-to-Action rates are the following, 22.5% of app users register in e-Commerce apps and about 12.5% make purchases via these apps, around 6.5% to subscribe for product or service. With games, the install-to-action rate for register – 17.5%, purchase – 12.5% and subscription – 15%.
When it comes to travel apps, only 22.5% actually register, 15% pay and 7.5% subscribe to travel app plans. Finally, for the utility app category install-to-action for register is 17.5%, purchase – 7.5% and subscription – 10%.
App Install-to-Action Rates, by category
Source: Liftoff
Any mobile advertising rates analysis wouldn’t be complete without by platform analysis, so the next up is the Purchase Cost on Android versus iOS.
Platforms Purchase Costs
Historically, iPhone and iPad users are wealthier and spend more money via their mobile devices, the Android platform is being known for having a bigger reach, being more popular, especially in Latin America and Africa. Thanks to this fundamental difference we see that across all analyzed app categories: e-Commerce, Finance, Gaming and Social we see that it’s more expensive to generate a purchase on the iOS side. The reason is simple – there are money there that app marketers are after, hence the competition is higher and hence it costs more to generate a purchase.
In 2023, the purchase CPA rate for the e-Commerce app category for iOS was $65.00, for Android it was $55.00. For the finance app category, it cost $75.00 to generate a purchase for iOS and it cost $65.00 to do the same on the Android side. For the gaming app category, the numbers were smaller, the purchase CPA rate for iOS was only $40.00 and for its Android counterpart even less – $30.00. For the social app category, a single purchase on iOS cost app markers $50.00 and $40.00 for Android.
Purchase CPA, by platform in 2023 ($)
Source: Liftoff
Moving alone from platforms to geographies, let’s see how much does it cost to generate a purchase inside a mobile app in APAC (stands for Asia and Pacific countries), EMEA (stands for Europe, Middle East and Africa) LATAM (stands for Latin American Countries) and NAR (stands for North American Region).
Regional Cost Per Action Rates
Among four major world regions, Latin America stands out as the place where app marketers see the lowest rates for both purchases and subscriptions, specifically the purchase CPA was $23.00 and subscription CPA was $29.00. But as with any local price tag assessment, one would need always factor in how these figures correlate with a local economy, meaning $5 in countries like Argentina, Brasil has a different value as opposed to North America, where a single purchase costs app marketers almost $67.00 (the highest figure for all regions) and a subscription is slightly less – $59.00.
Cost Per Action Rates, by region
Source: Liftoff
Zooming in from regions to specific countries, we see the following picture. The US has the highest CPA rates across the board for all app categories, with the highest average rates for e-commerce ($68.00), finance ($75.00), gaming ($45.00), and social ($52.00). Brazil is on the opposite end of the spectrum, having the lowest CPA rates in most categories, with the lowest average rates for e-commerce ($35.00), finance ($45.00), gaming ($28.00), and social ($30.00).
Cost Per Action Rates, by country
Source: Liftoff
After giving an extensive look at the CPA rates for mobile ad networks, let’s turn to how much does it cost to generate an action on the Facebook Ads and Google Ads platforms.
Facebook Ads Cost Per Action
There are several factors that influence cost per action rates for the Facebook Ads platform. For instance, different industries and app categories varies in levels of competition and user engagement, CPA rates for finance apps are higher due to high value of customer acquisition, on the other hand – the utility app category has much lower CRA rates because the value of customer acquisition is significantly lower compared to finance.
Target audience and demographics have also an impact on the Facebook Ads CPA rates. Targeting specific segment of a population, that is more affluent and has a greater buying potential, lead to app marketers spending significantly bigger budgets and it drives CPA rates up.
In addition to that, geographical location, ad quality and relevance, ad placement and format are also on the list of factors that influence Facebook Ads Cost Per Action rates.
In 2023, the Facebook Ads CPA rates were as follows: e-Commerce apps – $22.50, finance – $41.23, gaming – $21.38, social – $23.10, travel – $26.05, and utility – $16.92 per action.
Average Cost Per Action, by app category ($)
Source: WordStream, HunchAds, Instapage
And finally it’s time to give Google Ads due credit, as being the second part of the mobile advertising duopoly.
Google Ads Cost Per Action
Similar to the Facebook Ads platform, Google Ads cost per action rates are influenced by the same factors. In 2023, Facebook Ads CPA rates were as follows: e-Commerce apps – $45.27, finance – $56.50, gaming – $29.38, social – $34.25, travel – $44.55, and utility – $22.75 per action.
Average Cost Per Action, by app category ($)
Source: WordStream, HunchAds, Instapage
Final Thoughts
By now the initial focus of app marketers on the CPI (Cost-Per-Install) metric is shifted toward CPA (Cost-Per-Action). To make any app business sustainable it is paramount to be able to calculate its ROI and to do that you need to know your costs of acquiring such actions as purchases and subscriptions. CPA rates for both purchase and subscription vary by industry and platform and the 2020 global pandemic has significantly changed the rates thanks to its huge influence on the global economy.