

Since the dawn of the Internet, digital advertising has been the major engine that drove its growth. Between two business models – paid and ad-supported the majority of website owners chose the latter and this is how we’ve got this notion of the “free” Internet, when people can use lots of online services, not paying for them but saying “yes” to watching ads.
In the year 2008, Apple and then Google launched their app stores – a revolution in the world of software distribution and it triggered digital advertising transition from desktop to mobile. It subsequently lead to advertising in apps and then, ultimately, to the rise of the mobile in-app advertising industry.
The general trend of the last several years has been that people spend more and more of their mobile time in apps and not in a web browser opening websites. Following this trend, mobile advertisers and publishers have been focusing on running ad campaigns inside mobile apps to find new users for their apps or maximize their revenue respectively.
Running mobile ad campaigns, one of the crucial pieces of information that mobile advertisers need to know is – what is an average CPM? In other words, how much money do I need to spend to show ads of my app to a certain number of people? From a publisher’s perspective this question sounds differently – how much should I expect to earn running ads inside my apps – what is an average eCPM?
CPM stands for Cost-Per-Mile, which is a techy way of saying Cost-Per-Thousand or Cost Per Impression. It tells the advertiser how much a thousand ad impressions costs, regardless if the ads were clicked on or not. Hence from an advertiser’s perspective it’s the least attractive online advertising model and yet it is important one for advertisers to plan their advertising budget.
To calculate it the following formula is needed:
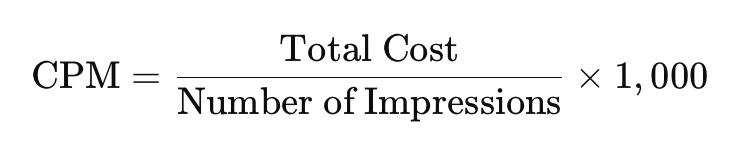
Where Total Cost is how much a specific ad campaign costs and Number of Impressions is how many impressions were generated within duration of an ad campaign.
When we look from a mobile publisher’s perspective, this benchmark transforms to another one – an Effective Cost Per Mile or simply eCPM model.
To calculate it the following formula is needed:
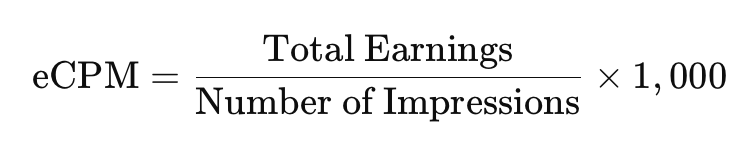
Where Total Earnings is how much revenue was generated within a specific ad campaign. This benchmarks is useful for publishers to assess effectiveness of different ad placements in their apps, performance of particular ad creatives and other parameters.
To put CPM and eCPM in a context, among all existing digital advertising metrics – CPM, CPC, CPL, CPA, the last one is the most valuable to mobile advertisers, it stands for Cost-Per-Action because it measures a cost of a specific action that people take with a digital product. But since the CPM continues to be one of the business models that digital advertising platforms are run, advertisers need to keep their taps on CPM rates.
Looking from the publishers’ side of the mobile advertising equation, eCPM has been the metric, because running campaigns based on this model, they are being paid for how many times ads were shown inside their apps and so they shouldn’t be concern about if people actually take any action as a result of seeing those ads.


Mobile advertising rates vary per industry, ad format, ad delivery channel, geolocation, mobile OS, device type, physical location, time of day, time of year, and more. In this guide, we want to bring up the industry statistics to highlight average mobile ad CPM and eCPM rates for various channels, industries, and locations, as well as mobile advertising spendings.
Each advertising platform is unique at what eCPM it’s capable to provide and so we’re going to explore data from several leading platforms such as Appodeal, MAF and Udonis to give you average eCPM rates across these platforms.
Key Mobile Ad Rates data points
- 2024 global mobile advertising projected spending – $400 billion
- 2024 US mobile advertising projected spending – $174 billion
- 2023 Google’s advertising revenue – $238 billion
- 2023 Facebook’s advertising revenue – $154 billion
- 2023 Facebook Ads CPM rates – $14.00
- 2023 Google Ads CPM rates – $10.50
- 2023 Display eCPM rates – $2.50 – $4.50
- 2023 Video eCPM rates – $4.70 – $10.00
- 2023 Rich Media eCPM rates – $5.40 – $9.00
- 2023 Programmatic eCPM rates – $3.40 – $5.20
- 2023 Contextual eCPM rates – $3.30 – $5.20
- Geographical eCPM rates – $4.30 – $6.20
- Seasonal eCPM rates – $4.30 – $7.20
- Device-specific eCPM rates – $3.80 – $4.80
Having these mobile advertising revenue data points covered, let’s dive into what mobile ad spending looks like and analyze data collected for the last several years.
Top Mobile Advertising Companies:
Let’s begin with setting up the stage and covering mobile advertising spendings over a period of time globally, as well as limited to the US market.
Global mobile ad spending
According to Statista, globally mobile advertising spend rose $198 billion in 2019, followed by $227 billion in 2020, $360 billion in 2023 and it’s projected to reach $400 billion by the end of 2024.
Since the inception of a modern smartphone back in 2007 and the launch of two major app stores in 2008 – the Apple’s App Store and Google Play Store from Google, online commerce has been rapidly moving towards mobile adoption and hence above mentioned ad spends just reflect the scale of this shift and underscore the fact that all digital advertising innovation has been happening on mobile as well.
Among the factors that have been shaping global mobile advertising spend growth are technological advancements, changes in consumer behavior, economic conditions, shifts in advertising strategies, privacy regulations, and data usage.
Throughout this period, the smartphone adoption by global population continued, in 2023 raising the total number of smartphone users to 6.8 billion globally. 5G technology, the next step in the evolution of mobile connectivity, was introduced in 2019 and was widely adopted in the following years, contributing to the growth of mobile ecosystem and mobile ad spending on it. Also growth of specific app industry sectors such as gaming, social media, shopping, and entertainment provided more platforms for mobile advertising.
On the consumers’ behavior side, the increased mobile usage and the rise of mobile commerce significantly contributed to the growth of mobile ad spend. Due to the COVID-19 pandemic, in 2020 the world economy got both hit in certain areas and boomed in others, which had a big impact on the mobile advertising spend, inflation and changes in consumer spending power dictated where and how advertisers spent their budgets.
That was also the period when more and more advertisers were shifting their ad budgets from traditional non-digital channels to digital and programmatic advertising. And, of course, the rise of TikTok and continuous growth of Instagram and YouTube became the focal point of mobile advertising strategies. Video content itself became more and more popular and it caused the dominance of video ads that provided higher level of engagement and conversion rate.
Last, but not least, the introduction of the Apple’s App Tracking Transparency framework and new privacy regulations such as GDPR caused drastic changes on the mobile ad landscape.
Global mobile advertising spend, 2019-2024, ($billion)
Source: Statista
US mobile ad spending
Mirroring the global trend for mobile advertising spend rising year-after-year, we also see that the US mobile advertising spending has been climbing up steadily.
Let’s unpack the data you can see on the graph below, year by year, starting with 2019 – the year before COVID-19 pandemic hit the world.
Back in that year, the growth was powered by an increased smartphone penetration – people continued to switch to a smartphone from a featured phone, as well as they bought latest iPhones and Android running smartphones as their first phone. The more phones in peoples’ pockets the more virtual real estate for mobile advertising, the more opportunity for advertisers to run their ad campaigns. At the same time, more businesses adopted the mobile-first strategy brining more businesses on mobile quicker, in many cases bypassing the desktop altogether. All these factors contributed to the total mobile ads spending in the US equal to $87 billion.
Switching to 2020, the year when the global pandemic changed the course of the global economy. The worldwide’s necessity to keep people at home under lockdowns trigged digital transformation acceleration. Many mobile technologies that were on a trajectory to be transformed within next several years took that leap in a year and it caused massive mobile tech adoption rise. People spent much more time on their mobile devices for shopping, entertainment, and communication. On top of it, there was a significant increase in mobile commerce that lead to a higher advertising spending to capture this growing market. It all resulted in breaking the $100 billion threshold in 2020 and reaching $104 billion in mobile ad spending in the US.
The following year, the mobile advertising industry was still under the impact COVID-19 but, in addition to that, advancements in mobile ad tech and the rise of video advertising contributed to the continuation of the mobile ad spending increase around the globe and in the United States in particular. The advancements manifested as enhanced targeting and measurement capabilities and, of course, a quick growth of video advertising was triggered by a fierce competition between two dominated video platforms – TikTok and Instagram. In 2021 mobile ad spending in the US reached all time high of $120 billion.
There is one factor the sets the tone for development and adoption of many mobile technologies, as well as rise or fall of advertising spend on mobile it is connectivity, specifically introduction of new data transmission standards. In 2022, massive rollout of the 5G significantly improved mobile internet speeds and reliability that boosted mobile usage experience. In conjunction with the wide adoption by advertisers such social media ad formats as Stories and Reels, 5G allowed the next US mobile ad spending record of $137 billion.
In 2023, continued growth in programmatic advertising and the rise of influencer marketing on mobile platforms lead to the next jump of mobile ad spending in the US – a whopping $155 billion.
If the current forecasting model for this year mobile ad spending in the United States is correct, we should expect this year around $174 billion to be spent on advertising products and services on mobile devices in the US.
US Mobile Advertising Spending, 2019-2024 ($billion)
Source: eMarketer, Statista
Mobile advertising is just one branch of the advertising business, let’s put it in perspective and compare with other branches to see how it stacks against them.
Looking at the advertising on a select media in 2023 we see that mobile advertising was a clear leader, with $155 billion (8% more than in 2022) – more than any other type of media. The second closest was TV with $84 billion ($3 billion less than in 2022), followed by Social Media with $75 billion (5% more than in 2022), Online video – $50 billion (15% more than in 2022) and others had significantly less amount of money spent on them.
So overall, Mobile Advertising, Online Video, Social Media and Out-Of-Home continued to grow, while TV, Radio and Newspapers were in decline.
US Ad Spending on Select Media, 2023 ($billion)
Source: eMarketer, BIA and MAGNA
The most valuable insight from the ad spending on select media last year is the following. Since the inception of the modern smartphone era, there has been a gradual but steady growth of the amount of time (and money) people spend with their mobile phones, which lead to finally spending more time & money on smartphones than on desktop computers.
This shift has been on the radar of online advertisers and it lead to also gradual transition of online advertising budgets from the desktop to mobile. You can see this transition in numbers on the graph below. By 2019, already the desktop claimed only 46% of online ad spending, against 54% on mobile, the following years desktop had been loosing 3-4% a year and by 2023 only 32% of online advertising spending was on the desktop with a whopping 68% on the mobile. It’s projected that this year the mobile ad spending on mobile will continue to rise and reach 70%, leaving the remaining 30% to the desktop.
Global online ad spending desktop vs mobile percentage, 2019 – 2024 (%)
Source: eMarketer, Statista, MAGNA, Zenith Media, BIA
Now let’s switch the gears and take a look at the data for mobile ad spending in various countries. Data for how much money is spent on mobile ads in a particular country reflects on the size of its economy and how healthy it was. The dynamic of year-over-year growth or decline brings up a picture of how fast mobile penetrates different branches of this country’s economy.
To build a comprehensive picture, we are analyzing mobile ad spending data for five countries: the US, China, UK, Japan, and Germany. The data points cover the years 2019-2023, with projections for 2024. Throughout this period, the general trend remains consistent: the US market is the leader, followed by China with a $10-15 billion gap, and then the other countries.
In 2019, US mobile ad spending was $80 billion, Chinese was $65 billion, the UK’s was $12 billion, Japan’s was $9 billion and Germany’s was $7 billion. By 2023, US mobile ad spending reached $155 billion, China’s $130 billion, UK’s $22 billion, Japan’s $17 billion, and Germany’s – $13 billion. For the 2024, the projections are: the US at $180 billion, China at $150 billion, UK at $25 billion, Japan at $20 billion, and Germany at $15 billion.
Global Mobile Advertising Spending, 2019-2024, by country, ($billion)
| Year | USA | China | UK | Japan | Germany |
|---|---|---|---|---|---|
| 2019 | 80 | 65 | 12 | 9 | 7 |
| 2020 | 92 | 78 | 14 | 10 | 8 |
| 2021 | 108 | 92 | 16 | 12 | 9 |
| 2022 | 125 | 106 | 18 | 14 | 11 |
| 2023 | 155 | 130 | 22 | 17 | 13 |
| 2024 | 180 | 150 | 25 | 20 | 15 |
Source: eMarketer, Statista, MAGNA, Zenith Media, BIA
Since 2008, the mobile app industry has been under the control of the Apple – Google duopoly, for mobile advertising there is another duopoly of Google and Facebook. Starting 2020, this duopoly has been actively undermined from one side by Amazon and from another by TikTok.
As of 2020, mobile advertising spending on Google reached $50 billion, on Facebook that figure was $40 billion, for Amazon only $15 and modest $5 billion for TikTok. But it was only the beginning, by 2023 advertisers spent $80 on Google, $65 on Facebook, $35 on Amazon and $30 on TikTok. Clearly the growth of mobile advertising spending on various platforms was the fastest on TikTok – either doubling or at least gone up 150%.
For 2024, it’s projected the advertisers will spend around $40 billion on TikTok but it is a big “IF”, given the fact that the US law, that forces the TikTok’s owner Bytedance to either sell the company of be banned in the US, was passed earlier this year.
US Mobile Ad Revenue, by company 2019-2024 ($billion)
| Year | Amazon | TikTok | ||
|---|---|---|---|---|
| 2020 | 50 | 40 | 15 | 5 |
| 2021 | 60 | 47.5 | 20 | 10 |
| 2022 | 70 | 55 | 27.5 | 20 |
| 2023 | 80 | 65 | 35 | 30 |
| 2024 | 90 | 75 | 52 | 40 |
Source: eMarketer, Statista, company financial reports, industry reports
For years, before the arrival on the scene the TikTok and Amazon Ads, the mobile advertising industry has been driven by two dominating players – Google Ads and Facebook Ads. Hence information about the ad spend on these major platforms is essential to get a comprehensive view on the mobile ad rates. Let’s first analyze Cost-Per-Mile rates for the Facebook Ads platform.
Top Mobile Advertising Companies
Facebook Ads CPM Rates
In 2019, the price of 1,000 ad views on the Facebook Ads platform was $9.00, the next year the COVID-19 global pandemic significantly impacted the Facebook CPM rates which reached $11.00 per 1,000 ad views. The next year Apple’s introduction of the App Tracking Transparency (ATT) framework directly impacted Facebook Ads platform. Facebook lost the ability to track iOS app users behavior across multiple apps and therefore measure mobile ad performance. The competition for targeted ads rose and it caused the Facebook Ads CPM to shoot up to $17.60 per 1,000 ad views.
Despite the continued impact of ATT, as well as inflation and economic factors, by using AI algorithms Facebook managed partly compensate for the loss of cross-tracking on iOS and that year the CPM rate went down to $12.40. In 2023 thanks to new enhanced video ad formats and the general shift of ad budgets towards digital ads the CPM rates went up again and reached $14 per 1,000 ad views.
For this year, it’s projected that the CPM rates will continue to rise and reach $15.00, this forecast is based on the assumption that more advertisers will commit their mobile ad budgets to Facebook and in particular its highly impactful Reels, therefore causing the competition rise and the CPM rates boost.
Facebook Ads CPM Rates, 2019-2024 ($)
Source: Statista, eMarketer
From one pillar of the digital advertising duopoly to another one – Google Ads.
Google Ads CPM Rates
Google Ads Cost-Per-Mile rates are under influence of the same factors as the Facebook Ads rates – economic conditions, privacy regulations, market competition, advancements in tech and, of course, consumer behavior. Among these the most impactful were privacy regulations. For one, the introduction of GDPR in Europe forced advertisers – and not only in Europe – to change their advertising strategies. In particular, when access to personal data became much more limited, many advertisers switched from behavioral targeting that required using users personal data to contextual targeting, which is based strictly app users’ intent. The Apple’s ATT framework and Google’s own Privacy Sandbox one impacted how mobile ads were targeted and measured, influencing CPM rates ad advertisers adjust their strategies.
In 2019, mobile app publishers made $6.50 per each 1,000 views of advertisers’ ads displayed in their apps, the next year this figure was fractured from $6.00 at the first part of the year, when many advertisers hit abrupt pause on their advertising campaigns to $7.50 closer to the end of the year, when many advertising campaigns were resumed.
In 2021, the year when the global economy began slowly recover from COVID-19 and many advertisers redoubled their marketing budgets, Google Ads CPM rates shot up to $8.50, followed by $9.00 in 2022 and finally $10.50 in 2023. According to projection for this year, it’s expected the Google Ads CPM to range from $11.00 to $12.00, driven by further advancements in ad technology and increased demand.
Google Ads CPM, 2019-2024 ($)
Source: Oberlo, Statista
It’s time to switch to the mobile publishers’ side and analyze various types of eCPM rates.
eCPM Rates
In today’s mobile advertising market, publishers can track and apply various types of cCPM to their business, including Display, Video, Rich Media, Programmatic, Contextual, Geographical, Seasonal, and Device-Specific cCPM.
Display eCPM Rates
First up is the Display eCPM that is used to measure revenue generated via banner, interstitial or native ads. When we look at what factors influence Display eCPM to fluctuate, there are several usual suspects such as improvement in ad targeting, programmatic buying, 5G technology adoption, ad blockers, better analytics and more. But there are several factors that deserve a closer scrutiny – screen time and privacy regulations. In 2019, the pre-pandemic year, the average daily screen time in the US was 3 hours and 45 minutes, by 2022 it rose to 4 yours and 29 minutes and by 2024 it’s projected to reach 4 hours and 39 minutes.
Such privacy regulations as GDPR in Europe and CCPA in the US have affected data availability for ad targeting, impacting eCPM rates. So having all these factors in mind, let’s see how the display eCPM have been changing over the years.
In 2019, the eCPM for banner ads was $1.50, for interstitial ads $3.00, and for native ads $2.00 per 1,000 ad views. In 2020, the eCPM increased to $1.80 for banner ads, $3.50 for interstitial ads, and $2.20 for native ads. By 2023, these figures had risen to $2.50 for banner ads, $4.50 for interstitial ads, and $3.00 for native ads. The forecast for 2024 predicts that by the end of the year, banner ads will generate $2.80 per 1,000 ad views, interstitial ads $4.80, and native ads $3.30. These trends indicate that interstitial ads remain the most lucrative for mobile app publishers, as they are hard for users to miss.
Display eCPM Rates, by type 2019-2024 ($)
Source: eMarketer, Statista, Data.ai, MoPub, Pubmatic, AdColony, AdExchanger
Now let’s switch to video eCPM rates and how lucrative these have been for mobile app developers for the same period of time.
Video eCPM Rates
There is a significant overlap in factors that influence both Display and Video eCPM rates but there are several that are unique to the latter. The boom of video streaming platforms such as YouTube, TikTok and OTT services such as Netflix, Amazon Prime, Apple TV+, Hulu and others lead to significant increased in adoption of video ad formats by mobile app publishers.
Another factor that influenced Video eCPM rates was introduction of interactive and shoppable videos that allowed online shoppers to buy products or services via video ads. And finally, wide adoption of 5G technology and improved smartphone hardware allowed for a higher quality video ads to be served on a big scale and let more advertisers to advertise their products and it lead to the increase of Video eCPM rates as well.
In 2019, the eCPM rate for In-stream Video was $4.00, for Rewarded Video it was $8.00, and for Out-stream Video it was $3.50. By 2023, the In-stream Video eCPM had increased by 50% to $6.00, Rewarded Video eCPM rose to $10.00, and Out-stream Video eCPM reached $4.70. The forecast for this year predicts a slight increase for In-stream Video eCPM to $6.50, Rewarded Video eCPM will rise to $10.50, and Out-stream Video eCPM will remain nearly flat at $5.00.
Video eCPM Rates, by type 2019-2024 ($)
Source: eMarketer, Statista, Data.ai, MoPub, Pubmatic, AdColony, AdExchanger
Next up to review are rich media eCPM rates, which represent interactive, expandable and playable mobile ads.
Rich Media eCPM Rates
Rich media ads, in contrast with regular display ads that are static, consist of multiple elements such as video, audio and other elements that make them dynamic and encourage mobile users to interact and engage with the content. There are three major type of rich media ads – Interactive, Expandable and Playable. The common denominator for these three types is that throughout the entire period Playable eCPM rate has been always the highest with Interactive one on the second place and Expandable one showing the least encouraging numbers.
Playable ads have been particularly effective for mobile games advertising, allowing mobile gamers to actually play games, get engaged and be more receptive to trying new games. It lead to the increase of their popularity among advertisers which resulted in a significant increase of the eCPM rates for playable ads. On the other hand, enhanced measurement tools and analytics have allowed mobile advertisers to better track the performance of Rick Media ads.
In 2019, Expandable eCPM rate was $4.00 per a 1,000 ad views, Interactive eCPM rate was $5.00, and Playable eCPM rate was $7.00. By 2023, Expandable eCPM reached $5.40, Interactive was $7.00 and the best performer among these three, the Playable eCPM was $9.00.
Rich Media eCPM Rates, by type 2019-2024 ($)
Source: eMarketer, Statista, Data.ai, MoPub, Pubmatic, AdColony, AdExchanger
Moving along from Rich Media to Programmatic Media eCPM rates that help to measure revenue generated via Open Auction ad trading, Private Marketplace and Programmatic Guaranteed trading platforms.
Programmatic Media eCPM Rates
The set of factors that influence Programmatic Media eCPM rates are technological advancements, market dynamics, regulatory changes, and shifts in consumer behavior.
The most influential among tech innovations have been AI algorithms that significantly improved mobile ad targeting, allowing more effective reach and higher eCPM rates. Thanks to the big volumes of data accumulated, programmatic platforms can now target specific audiences based on their behavior, interests, and demographic. The further development and sophistication of real-time bidding streamlined the ad buying process, increasing its efficiency and competitiveness. In its turn it has lead to better allocation of ad inventory and increased eCPM rates thanks to higher demand for quality impressions.
In addition, more advertisers went into programmatic advertising space causing further eCPM increase. Higher demand for specific market segments in high-value markets also contributed to the programmatic eCPM rates increase.
Between the three types of programmatic media eCPM Programmatic Guaranteed has been the highest yielding one. In 2019, real-time bidding or open auction brought mobile publishers $2.50 per a 1,000 ad views, private marketplace eCPM rate was $3.50 and programmatic guaranteed – $4.00 per each 1,000 ad views sold. By 2023, open auction eCPM rates went up to $3.40, private marketplace – $4.70 and programmatic guaranteed – $5.20. Looking at the forecast for 2024, we see open auction projected to reach $3,60, private marketplace – $5.00, and programmatic guaranteed – $5.50.
Programmatic Media eCPM Rates, by type 2019-2024 ($)
Source: eMarketer, Statista, Data.ai, MoPub, Pubmatic, AdColony, AdExchanger
Let’s shift gears again and go from programmatic media to contextual eCPM rates.
Contextual eCPM Rates
Context-wise mobile ads eCPM rates can be presented as article-based eCPM, app category-based, and keyword-based eCPM. When it comes to online content, the most significant improvements in contextual targeting algorithms have resulted from advances in natural language processing and machine learning.
Thanks to these advances, it became possible to better match ads to relevant content, resulting in higher engagement and eCPM rates. The growth of programmatic advertising was yet another factor that allowed more advertisers run mobile ad campaigns on scale using contextual ad placement, driving up eCPM rates.
Introduction of GDPR and CCPA limited the use of personal data, which decreased the value of behavioral targeting and increased the value of contextual one which was also instrumental for driving eCPM up.
For contextual eCPM rates, app category-based targeting has been the most lucrative for mobile app publishers, generating $4.00 in 2019, compared to $2.50 for keyword-based targeting and $3.00 for article-based targeting. By 2023, app category-based eCPM rose to $5.20 per 1,000 ad views, article-based to $3.90, and keyword-based to $3.30. Looking to the future, by the end of 2024, app category-based eCPM is expected to reach $5.50, article-based $4.10, and keyword-based $3.50.
Contextual eCPM Rates, by type 2019-2024 ($)
Source: eMarketer, Statista, Data.ai, MoPub, Pubmatic, AdColony, AdExchanger
Another important dimensions for mobile advertising are location, different level of local’s economy development, difference in cultures, different level of smartphone tech sophistication, and more.
Geographical eCPM Rates
The chief factor that has been influential throughout the last five years is how stable the economy has been in a particular region and how much it was impacted by COVID-19 global pandemic.
Additionally, fluctuations in currency exchange rates and high advertiser demand in regions with developed digital ad markets, such as the US, Canada, and certain European countries, drove geo eCPM rates higher. Conversely, in regions with less developed digital ad markets, the effect has been the opposite.
For three major regions involved: North America, Europe and Asia-Pacific the former demonstrated the highest eCPM rates. In 2019, mobile app publishers enjoyed $5.00 per 1,000 ad views rate, European publishers managed to generate $4.00 and app publishers in Asia-Pacific only $3.50. By 2023, app publishers in the US and Canada enjoyed eCPM rate – $6.20, in Europe – $4.80 and Asia-Pacific – $4.30. The forecast for the end of 2024 calls for $6.50 in North America, $5.00 in Europe and $4.50 in Asia-Pacific.
Geographical eCPM Rates, by type 2019-2024 ($)
Source: eMarketer, Statista, Data.ai, MoPub, Pubmatic, AdColony, AdExchanger
Sometimes not only context and location but seasonality also plays role and this is the topic of our next section – Seasonal eCPM.
Seasonal eCPM Rates
From the advertiser’s perspective, the most influential seasonal factors were the proximity of holiday seasons, back-to-school periods, and the summer season. Economic cycles, with their ups and downs, affected advertisers’ budgets and consumer spending power, while inflation rates specifically impacted the growth of mobile ad eCPM rates.
We should also mention event-specific factors such as big sport event like Super Bowl, Olympics, and World Cup were big opportunities for mobile advertisers, driving up eCPM rates around these events.
Undoubtedly, the holiday season eCPM rate has been the highest. In 2019, it was $6.00, compared to $4.00 for the back-to-school period and $3.50 for the summer season. By 2023, the holiday season eCPM reached $7.20, the back-to-school eCPM was $4.80, and the summer eCPM was $4.30.
According to the current estimate, by the end of 2024 the holiday season eCPM will reach $7.50, holiday season eCPM – $5.00 and the summer eCPM – $4.50.
Seasonal eCPM Rates, by type 2019-2024 ($)
Source: eMarketer, Statista, Data.ai, MoPub, Pubmatic, AdColony, AdExchanger
And finally let’s look how specific device has been impacting eCPM rates from 2019 t0 2024.
Device-Specific eCPM Rates
Influential factors for device-specific eCPM are 5G rollout, advanced in ad formats (interactive and playable ads), increase of the screen time, remote work & learning and ad blockers.
COVID-19 caused a number of lockdowns around the world, it lead to the rise in mobile device usage and screen time. People spent much more time doing more work remotely using their mobile devices and it applied to their entertainment as well.
It’s important to note that because people had to work from home their desktop computers usage, which had been in decline prior to 2020, skyrocketed and it impacted the desktop eCPM rates. Throughout the whole period we see the desktop eCPM rates being the highest.
In 2019, eCPM rate for ads displayed on desktop was $4.00, on mobile was $3.50, and the tablet eCPM was $3.00. In 2023, the desktop eCPM rates were still the highest – $5.00, with mobile eCPM holding the second place with $4.50 and the tablet eCPM had $4.00 per 1,000 ad views.
Device-Specific eCPM Rates, by type 2019-2024 ($)
Source: eMarketer, Statista, Data.ai, MoPub, Pubmatic, AdColony, AdExchanger
Final Thoughts
Mobile advertising market is mature and has been one of the major sources of digital publishers revenue, as well as instrumental for advertisers to reach their audiences. Mobile ad spendings have been substantially growing over a period of the last five years and will continue to grow as mobile continues to conquer more and more businesses worldwide.
Mobile ad eCPM rates vary by industry, mobile OS, geo location and specific mobile ad network. Between Android and iOS mobile platforms, the latter tends to generate more income for publishers.
Facebook and Google together control the major part of the mobile advertising market, but this status quo has been challenging by TikTok and Amazon Ads.